Should you know statistical models?

I’m working on an Executive MBA degree and my cohort is a blend of experiences and backgrounds from engineers to CEOs to doctors. During my last statistics class, we were learning about regression. One of my classmates asked whether or not we need to hire people that would do this work( stats) or if that is something we as leaders in the organization need to be aware of. That question is valid: should we at leadership level understand statistical models or should we hire people to do the work?

I think that the answer is both. Leaders within an organization dealing with data (whether business or tech) need to understand how these models can be used.  You also need to know that the people you are hiring aren’t just using tools that blackbox everything into drag and drop, but actually understand the models. I say this with caution as there are many tools out there that reduce development time and allow end users to quickly modify models without a lot of coding.

Let’s take an example: You want to hire a brand new team of data scientists because that is where data is going now. If you don’t have a data science team, you are missing out (says the industry trends).  Now, you’ve only worked with data by running queries in sql to get you averages, totals, and to some extent some forecasting in Excel. Should you understand what capabilities there are outside of the basics in order to grow your business with data? Yes! Absolutely. Otherwise, you wouldn’t know what to look for in your new hires or your new lead of data science. I say this knowing that many leaders may not know the math behind all these models.  So if you are a team lead, executive, or anyone working with data: go learn about what you don’t know. Maybe take a basics statistics course. You will build a stronger team; a team empowered with knowledge.

If you are an analyst that uses a tool that black boxes the model, go learn about it before using it. You will make better decisions knowing how the models work and you will be able to explain to other non-statisticians how to interpret the results and how to further use the models for their analysis.

Happy learning!

It takes a village

The old ways of software development went like this:

Business analysts, technical managers or architects, and key business owners would gather in a room and discuss over a few meetings what they wanted in a product. There was no involvement of the people actually doing the work until all the requirements were said and done. After the requirements were gathered, then it was the design document that needed to be scoped, after a few weeks/months on that, we finally got to development, testing, and finally production. That software development cycle is called Waterfall.

You can see how there could be many issues that it can cause specially with changing requirements, having the wrong people in the room, no partnership past requirements, etc. Now, with the Agile methodology we approach projects that promote faster, iterative cycles, and partnerships with all the people in the project. Where am I getting at, you ask? Well, that same process can be used when building out a BI or data platform.

The title of this post is “It takes a village” and it’s true, it takes the effort of both technology and business to implement a successful BI/Data platform. I am putting both BI and data platform in the same group because if you don’t understand your data (what you have and what you need), you won’t be able to empower users to use your BI platform.

Take this as an example. The IT department in your organization is planning on creating a data platform. You, a manager in the business analysis team, only hear whispers of it but you are not sure what is going on. A few months down the road, you receive and email from the VP of Data (in IT), asking for your team’s help to test the new platform. You volunteer because you are curious of what this means. When you go test, the data is all wrong, it’s missing data that is important for your team, and there was no quality test done on the data. Your trust on this new Data Platform is out the door!

This could have been easily avoided, if the right people were at the table. So, how do you know which people are the right people?

Survey the Users

Start off by figuring out who are the users of the current data. Is it finance, product development, accounting, human resources, etc. Meet with every team lead. I know that may be difficult specially with larger organizations. But hear me out – start with existing systems (database users or intranet site users) and gather metrics on use. That information will give you starting point. If you are in tech, align yourself with your business analysts and start with them. They are most likely your biggest users as they use data as part of their job. For each group you meet with,  gather the following:

  • list of data sources they use
  • whether that data is something the data platform will contain ( depends on what you are trying to accomplish with the platform)
  • Priority! You don’t need to build everything at the first go. Figure out what is important day 1 of launch.

Start small

Agile methodology teaches us that we implement changes in small increments. Figure out from your priority list, where can I start? What is the foundation work that I have to do? Is it an ETL framework to move data from one database to another? If so, how can I create that framework in small iterative increments?

Sharing is Caring

As part of your project, make sure that you are keeping the end users engaged. Once you have some working version of an ETL tool, show them. Demonstrate that their input matters. At the end of the day, they will be the users of the product that you build. But, be mindful of what is possible within your project timeline. Don’t over promise. Tell your team what is realistically possible so that no one thinks a requirement was missed. The key to this is communication.

Build a community

If a village is not a community then I don’t know what is. The BI/Data Platform you build will be used by many. As a developer, you will contribute to the backend and as business user, you will be using it everyday. Promote the idea within the teams that it takes everyone to make this work. Have user group meetings within your organization that enable people to share what they are doing with the platform. Have a collaboration tool (messenger app/email distribution list/website) that allows all users to share and collaborate with each other.

If you are building out a new BI/Data Platform or if you are looking to improve it, just remember to go on this journey with your business users. The journey will not be perfect; it will have its struggles, but at least you will have something to improve and grow over time.

Now go and create your data village.

Does your Tableau Server have a weak pulse?

blood-pressure-3312513_1280Do you know if your Tableau Server is healthy? When was the last time you checked with your “Tableau Doctor” to make sure your TS had a clean bill of health?

Well, if you haven’t done so – don’t be ashamed! I didn’t do it until after 2 years of running a production platform because I thought it was going to cost a lot of money to have Tableau do a checkup. This checkup is actually called a Tableau Server Pulse Check and all you have to do is ask your Account Rep to set it up. I’m going to walk you through what we did, and hopefully it helps you out.

What to expect?

Pulse Check is a WebEx session with a Tableau engineer and your account manager. They will go over the Tableau Server Configuration, the server stats (space, CPU, RAM), and the actual Tableau Server website.

As you are going through each part, the Engineer will provide guidance, best practices, and answer any questions you may have. At the end of the session, there will be action items, follow-ups, and a summary email regarding the Pulse Check.

How to Prepare

Review your configuration

By configuration, I don’t just mean TS configuration (that’s very important), but I also mean disk utilization, storage and memory footprint of all your servers, scheduled tasks such as backups, types of data source connections, and any other scheduled task or maintenance you run on your servers both in Production and DR. Specially in larger setups (clustered/high core count), make sure you understand where your servers reside and what runs on each node. If you have a system diagram, this is the time to update it and if you can, send it to your Tableau Engineer ahead of your Pulse Check meeting.

 Upgrades

Do you have an upgrade coming up? This is the best time to engage with the Tableau Engineer on your upgrade plans. Maybe you haven’t upgraded to 10.5 (that’s when Hyper was released) and you don’t know if you are ready for the upgrade. This is the time to talk about it. Side note here – I was informed that there’s a 10-30% space usage with Hyper. You may need to ask for more space before you even upgrade.

Get the Right People

You will need administrator access to login to Tableau Server. If you don’t have the access as a Tableau Server admin, make sure you involve your Systems Engineering team ahead of time and include them in the communications. The last thing you want is to not be able to login to the Tableau Server host(s) while you are starting your WebEx.

Questions

I can’t stress this enough: write down your questions! No, I’m not yelling at you, just strongly advising you to do this. You will forget what you want to mention because some other topic caught your attention. It’s best to have all your questions written and if you think they may require time, send them ahead of time to the engineer and account manager.

Takeaways

We had our Tableau Server Pulse Check in March and I learned a few things. I learned that we were doing things right! It’s reassuring to hear from the experts that we are on the right course and setup. Believe me, it wasn’t always that way and engaging with the community and attending Tableau Conference definitely helped us get here. There are a few things that we are improving on already and others that are on our roadmap like the 10.5 upgrade. Don’t be discouraged or feel like you’re going to be told that you don’t know what you are doing. That is not how Tableau works or how this community works. Reach out, ask a ton of questions, and don’t be afraid. We’re all here to support our growth.

One more thing: once you have the write-up from your Pulse Check, share it with your team. Whether that is at your Center of Excellence (CoE), internal Tableau User Group, or if you are small enough; your whole organization, share the good and the bad. Keep people involved and engaged.

If you haven’t done a Tableau Server Pulse Check, send an email to your account rep and set one up. Good luck!

Data source, why you no worky?

datasource-y-u-no-worky

How many times have you felt frustrated at Tableau Desktop or Server because your data source extract didn’t work or even worse it stopped working all of a sudden? Has the thought of going back to a live database or even going back to what you used to do before Tableau ever cross your mind? Well, STOP RIGHT NOW! In this post, I’ll share with you a very interesting scenario that even had Tableau Support stumped. Just for clarity, this is for database connections only, but similar debugging strategy can be applied to any data source.

Scenario

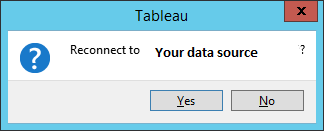
I was building out a new data source that connects to a Postgres database. The data source has multiple inner joins but nothing complex. Following proper Tableau guidelines, this is not a custom query. With a live connection, I had no issues rendering a viz. But, once I attempted to create an extract: BOOM! I would get an error. The error read: “reconnect to database?”.

reconnect to data source error

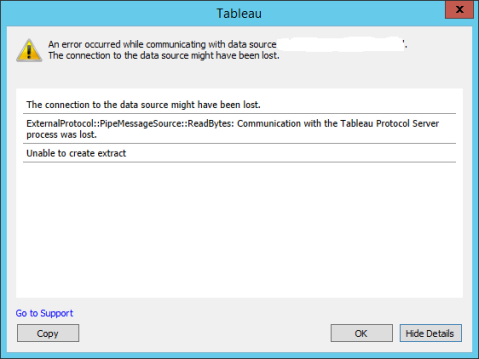
If I hit No, then I would get the full error:

Tableau Protocol Server process error

Solution

Triage

When I get an error on Tableau Desktop regarding extracts, the first thing I do is look at the logs. They are located under your Tableau repository (click on File and then Repository Location to see where it exists). Look through the logs for a few keywords: error, extract, data source name. If you can reproduce the issue then clean out your log files, reproduce the issue, and then search through the log files again. This will take away any issues with looking at old errors that are not relevant to your issue.

In my case, all I got was that the connection to the Tableau Protocol Server process was lost and nothing else. What do you do in this case? Who do you call? Well – if you can query the database and have no issues there such as syntax, database connection, or authentication, then submit a Tableau Support Case. That is what I did. One important thing here – keep a copy of your Tableau Desktop log files. They will help Tableau Support.

Tableau Support

Depending on the severity of your issue and the backlog, you may have to wait a day or two before you get a response. Once I got a tech assigned, we did a WebEx and were able to reproduce the issue. Re-collected the log files and the case was moved to Level 2. We had a second WebEx and gathered more stats but again we couldn’t figure out the issue.  Let me share what additional logs we generated so you have a better idea of what goes on.

Tableau Desktop in Debug Mode

Did you know Tableau Desktop can run in Debug Mode? It just means it logs more information. Now, I probably should have done that at the beginning to see if it got me anywhere. But, will definitely do it next time. If you are curious, before you open Tableau Desktop, open a command prompt or terminal. Change your directory to the location of your Tableau Desktop exe file and run this command:

tableau.exe -DLogLevel=debug

Generate and ODBC Driver Trace

Since the issue was with Postgres, we wanted to make sure that there wasn’t an issue with the database driver. The driver is basically how Tableau Desktop and Server connect to your database. There are many database systems that Tableau supports and for most (with the exception of Postgres because Tableau ships with it), you will need the database driver installed to use it.

The Tableau Support tech asked me generate the ODBC driver trace before we started Tableau Desktop and re-started the extract. Why, you may ask. Well, an ODBC driver trace will log all the columns that are being requested and their data types. If there are any errors, they will be logged there as well.

To start an ODBC Driver trace, open ODBC Administrator tool and click on Tracing tab. Choose a location to save the trace file and then start the trace. Open Tableau Desktop, reproduce your issue and then stop the trace from the same ODBC Administrator tool.

We collected all this information to pass on to Engineering to figure out what was going on. For your own curiosity, take a look at these files to see what information you can gather and maybe it will take you closer to solving your issue.

Intermission

While I was waiting to hear back from Support, I kept trying to think of why this data source was having an issue. There were no database changes, there was no change of permissions, connections, Postgres driver, etc. In fact, we had other data sources on Tableau that used the Postgres driver and had no issues. We were able to do simple joins with other tables, so what was different?

Mystery Solved!

what-if-i-told-you-your-datasource-can-be-fixed

If it’s not in the database schema well maybe it’s in the DATA ITSELF?! That’s what I told myself. That’s exactly what it was. Postgres defaults to client character encoding of UTF-8. That doesn’t work when your data has special characters in them. There was one specific column that had special characters. Since I knew the data behind it, I knew which one it was.

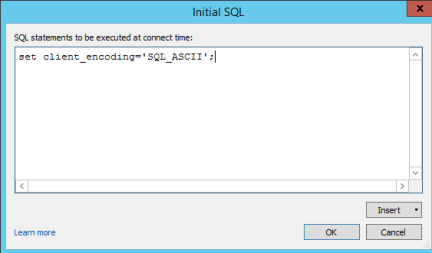
Now that I knew what my problem was, how did I fix it? I could create a TDC (Tableau Datasource Customizations) file for that. Link below for more details. But, what I did instead was to set an “Initial SQL” statement. In Tableau, you could set an initial sql statement which Tableau will execute prior to running your data source query. In Postgres, you can set the character encoding. I added a simple line:

SET CLIENT_ENCODING=SQL_ASCII

initial sql

TA-DA! My extracts worked and the issue was resolved. Next time you have an issue with your extracts, think about the data you are using. Does it have special characters? They may be the cause of your problem.


Resources

Postgres Character Encoding: https://www.postgresql.org/docs/current/static/multibyte.html

Tableau Datasource Customization Files: https://onlinehelp.tableau.com/current/pro/desktop/en-us/odbc_customize.html#global_tdc

ODBC Trace: https://docs.microsoft.com/en-us/sql/odbc/admin/setting-tracing-options

Is anyone using my viz?

So you think you’re viz is not popular? Do you think you’re the only one that’s using it? Think again!

If you’ve ever worked with Tableau Server (or maybe you haven’t) and wondered if anyone was looking at your dashboard or published data sources, well, you don’t have to guess anymore. Tableau Server offers ends users various access points to get at this great question.

3 Simple Ways

1. “Who has seen this view?” Menu Link

Just click on your dashboard on the list view within the project and click on the three dots next to the name. You’ll see a menu option that says “who has seen this view”.workbook-who has seen this view
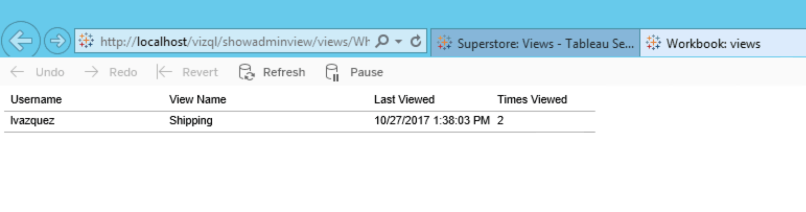
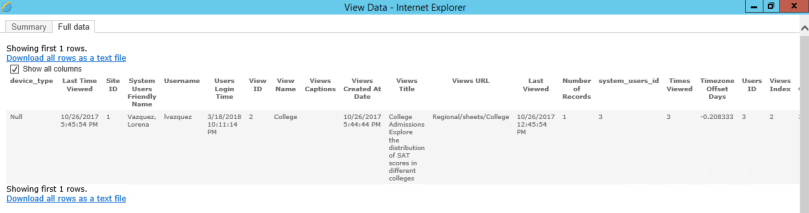
This provides you with access to the underlying data just like you would in any other workbook. Look at this progression below.

user-views.png
View after selecting link of “Who has seen this view?”
full row data
Full data records for user views. Great details regarding times and device.

2. Sort By View Option

If you want to know the most viewed workbooks in a project or overall, just change the sort on the list/grid panel.

views-sorted.png
Views sorted by Most-Least views. Switch the sort by to get more defined views.

3. Tableau Server Admin Views

Find out from your Tableau Server admin if they can post the data that is stored in the internal Postgres database (maybe this is not that simple – but there’s some great resources around this. Links below). There are some admin views that can help answer that question faster but always ask. I promise we don’t bite.

Metadata

Tableau Server stores a lot of metadata in its internal Postgres database. Not everyone can get to it and your admin has to enable access, but it’s not impossible.  This data is gold specially if you are trying to rework your content or crowd source new dashboard ideas.

What if you are an owner of a published data source and you want to know who is consuming it. Tableau Server is also good at telling you what workbooks use your published data sources. When you click on the data source you get a connected workbooks tab that shows how many workbooks are using it.

connected workbook

What if you want to know if you are a top contributor to your Tableau Server. One thing that I implemented at work (using open sourced workbooks from the great Server Guru Mark Jackson) is a Leader Board project.
The Leader Board project has dashboards that show the end-user who is the top publisher, viewer, and if you work in an organization where you have multiple groups like I do, you can encourage some friendly competition at who gets the top of the leader board. In addition, we are planning on sending out a version of this workbook to the internal Tableau User group to see if it increases adoption and usage.

Next time you are on Tableau Server and you think that maybe your viz is not in use, put facts to your opinion, it may just surprise you.


Resources:

Tableau Server internal database: https://onlinehelp.tableau.com/current/server/en-us/perf_collect_server_repo.htm

Out of the box Tableau Server Admin Views: https://onlinehelp.tableau.com/current/server/en-us/adminview_postgres.htm

https://onlinehelp.tableau.com/current/server/en-us/adminview_serveract.htm

Mark Jackson Custom Admin Views:  http://ugamarkj.blogspot.com/2014/08/custom-tableau-server-admin-views.html